How the Pricing Between Single-Family Homes and Condominiums is Suppressing Growth in the Condo Market (Wonky)
This week, we finished work on the Rand Quarterly Market Report, which will be published next week. In the Report, we look at the single-family and condominium markets throughout the region, including Westchester, Putnam, Dutchess, Rockland, and Orange Counties in New York, and Bergen, Passaic, Morris, and Hudson Counties in Northern New Jersey. It’s a really interesting report, and we’re proud that we provide all the data analysis and production in-house.
One of the things we’ve noticed as we’ve analyzed the markets is the pervasive weakness in many of the condo markets. Now, all the markets were hit hard by the market correction that started in 2008. But condos were hit worse. To give you an idea, Orange County was closing almost 4,000 single-family homes every year during the last seller’s market, hit bottom in 2009 with just under 2,000, and has remained close to that level for the five years since. So in Orange County, single-family homes are selling at about half the rate that they were at the height of the market.
By comparison, though, Orange County was closing almost 1,000 condos a year at the height of the market, and is now down to about 300 per year. So condos sales are down almost 70% from their height, while single-family sales are down about 50%.
So why the difference? Why have condos been hit so much harder? Indeed, you might think that condos would do better in a low rate environment, because they provide the inventory for first-time home buyers. And given the rate of move-up buyers going from condos to single-family homes, you would think that the single-family market sales rate would move mostly in tandem with the condo market.
Our theory, expressed a few times in the Report, has been that when the market corrected, the pricing gap between single-family homes and condos narrowed to the point that the first-time home buyers who normally make up the demand for condos were able to stretch to get into a house. That is, where the pricing gap between houses and condos is wide, entry-level home buyers don’t have the option to get a house. But when the gap narrows, those buyers can often afford to go right into a single-family home. As a result, single-family home sales start to make up a higher percentage of total sales, and condo sales go down.
Now, basic economic theory would tell us that the market would correct for this, that condo prices would start to come down in order to attract entry level buyers, thereby broadening the pricing gap. But those kinds of corrections take time. For example, both Orange County single-familiy and condo prices are down about 30% from the height of the market. They’ve gone down in tandem, but by going down together the raw dollar-value gap between them has continued to narrow. (That is, a 30% differential at $50 is $15, but a 30% gap at $40 is just $12.) We haven’t seen condo prices go down enough to bring back buyer demand.
We’ve noticed that trend not just in Orange County, but in Rockland, it’s neighbor to the west. Rockland has a moderately sized condo market that has also suffered more than the single-familiy market. Notably, we haven’t seen the same thing in Westchester, which has a larger and (because it’s Westchester) significantly higher-priced condo market. In Westchester, condo sales have been relatively strong, roughly in line with what’s happening in the single-family market.
Anyway, we decided to take a deep dive into figuring out whether the theory had support in the data.
Here’s the short answer: it does.
And here’s the long answer. We looked at condo and single-family sales in Westchester, Rockland, and Orange and compared them to condo sales in those markets for rolling year quarters going back to 2005, almost 10 years. Essentially, we looked at two metrics:
- The pricing gap between the average sales price for single-family homes and condos.
- The percentage of total transactions made up by condos.
Our theory says that if the pricing gap narrows, condos will make up a lower percentage of the total transactions in the market. That is, we’ll see fewer condo sales relative to the number of single-family sales.
And that’s what we found:
Orange. In Orange County, we found that as the pricing gap narrowed, condo sales fell much more than single-family sales. At the height of the market, the average sales price gap was about $120,000 and condos made about 20% of the total sales. By the bottom of the market, the pricing gap was down to about $60,000, and condo sales made up about 13% of total sales. Since then, condo prices (as expected) have dipped a bit, which has widened the pricing gap, but the percentage of condo sales has continued to go down, now all the way to 11%. That is, condos used to make up 20% of the market when the gap was wider, and has been about half that when the gap is narrower.
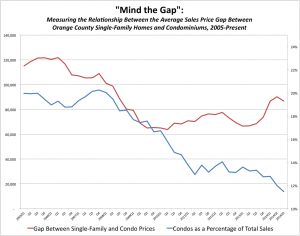
Basically, as you can see from the graph, when the red line (the gap) started falling, so did condo sales as a percentage of total sales. And that percentage has continued to drop even while the gap has flattened out over the past few years.
Rockland. We found the same dynamic in Rockland. Condos made up about 30% of sales at the height of the market, when the pricing gap was as high as $250,000. Today, condos make up about 20% of the market, and the pricing gap is hovering at about $175,000.
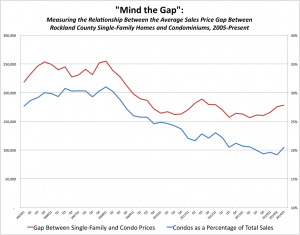
Again, you see the two lines relatively flat for a few years, but when the gap starts to fall, so do condo sales. As you can see, the decline has been a bit steadier than in Orange County, but you see the same relationship.
Westchester. Interestingly, we did not see quite the same thing in Westchester. At the height of the market, condo sales made up about 21% of the market, and the pricing gap was about $450,000, sometimes hitting as high as $500,000. Over time, the percentage of condo sales has remained relatively constant, fluctuating in a narrow band between 17% and 22%, usually right around 20%. Similarly, the pricing gap has been relatively constant, usually around $400,000. Now, that raw dollar value is very high because the prices are higher, but the gap as a percentage of the single-family home price has been between 45% and 50% throughout the time period. In other words, the relationship has been a little more stable.
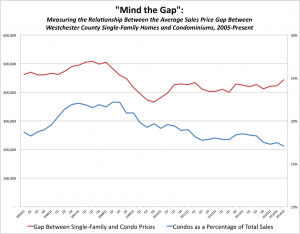
Again, we see the relationship between the gap and the percentage of condo sales, with sales falling as the gap falls, and then leveling out when the gap stabilizes.
Why has the Westchester market been more stable, with a relatively flat pricing gap and with condos making up a fairly constant percentage of total sales? Mainly, because prices are higher. It’s one thing for an entry-level buyer to stretch in Orange County, where the gap between condos and houses is $60,000. It’s quite another to try to go from a condo to a house where the gap is almost half a million dollars. Basically, a lot of people looking at condos in Orange can afford to buy houses, but very few people looking at the average priced condo in Westchester can afford to buy a house.
Conclusion
So what do we take from this? Basically, we think that the condo markets in Rockland and Orange need the single-family markets to start showing some price appreciation. It’s either that, or condo prices have to continue to go down, because until we start seeing that pricing gap between condos and houses widen, the condo market is going to continue to lose buyers to the lower end of the single-family market.